

%20(720%20x%20225).jpg)
 More Blog Posts
June 2026 - Market Recap

.svg)

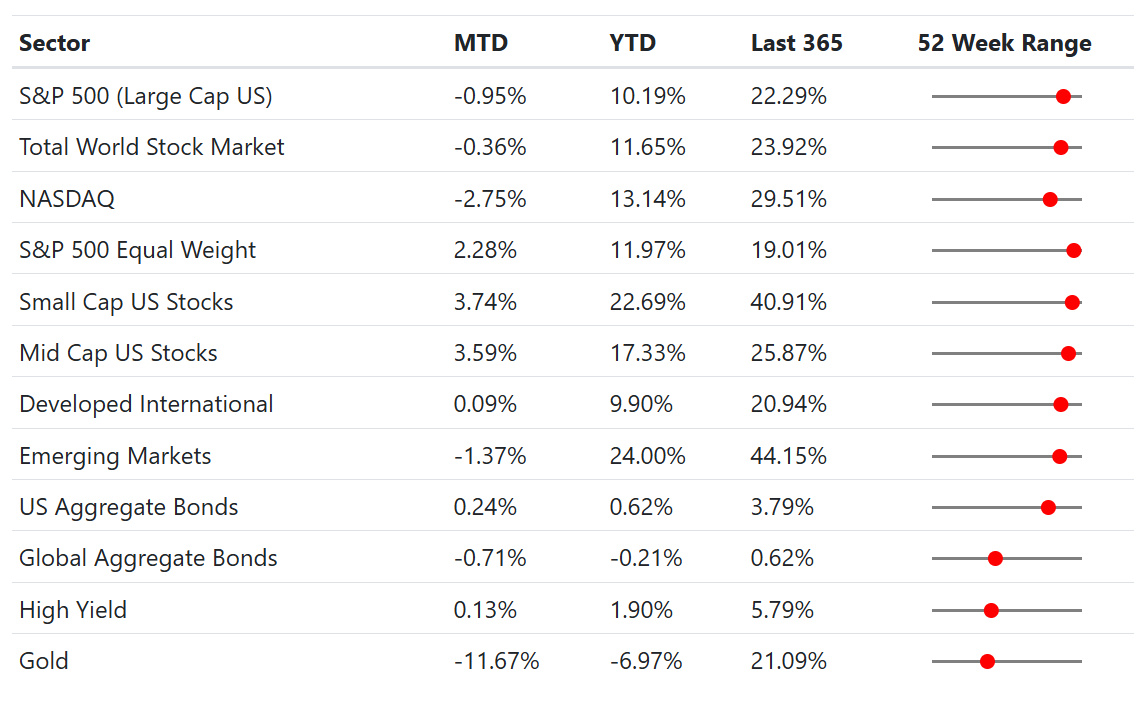
- U.S. large-cap stocks slipped in June, with the S&P 500 down about 1% as investors went risk off on the mega-cap technology names. The market rally however broadened, with the S&P 500 Equal Weight index rising 2.3% and small-caps gaining 3.7%, with Industrials, Health Care, and Financials as the best performing sectors.
- The war between the US and Iran moved toward a close. A preliminary peace deal reopened the Strait of Hormuz and sent oil sharply lower. Energy stocks are down 5.0% and Gold fell 11.7% on the month.
- The Federal Reserve held rates steady at 3.50%–3.75% at Chair Kevin Warsh's first meeting, but updated its projections with a more hawkish tone. Several officials now pencil in a possible rate hike this year, rather than a cut.
- Looking ahead: Second-quarter earnings season begins in mid-July and will test whether Big Tech's heavy AI spending is starting to pay off. That, along with the next inflation reading, will shape whether the Fed's hinted-at hike actually arrives.
- (Post-month note, as of July 1): The June jobs report came in soft, with just 57,000 jobs added against expectations near 115,000, even as unemployment ticked down to 4.2%. A cooler labor market could ease the hawkish lean the Fed signaled in June.
Data Dashboard
Stock Market
The S&P 500 slipped about 1%, and the tech-heavy NASDAQ fell 2.8%, both dragged down by a sharp pullback in the mega-cap technology and AI names that had powered the spring rally. Investors grew wary that the AI trade had run too far, and a few giants took the brunt of it. Step away from those names, and the month looked very different. The S&P 500 Equal Weight index rose 2.3%, mid-cap gained 3.6%, and small-cap climbed 3.7%, several of them finishing near 52-week highs. The average stock had a good June even as the index averages sagged.
The rotation was just as clear across sectors. Industrials (+7.3%) and Health Care (+6.6%) led, with Financials (+4.3%) close behind, as investors favored steadier, cheaper corners of the market. Communication Services was the weakest sector, down 7.2%, as large internet and media companies came under pressure with the broader tech reset. The technology sector finished roughly flat but divided. Big software names like Microsoft and Oracle posted their worst months in years, while chipmakers held up better through a volatile stretch.
The month's most anticipated IPO SpaceX went public on June 12, marking the largest IPO in history. It raised roughly $75 billion at a valuation near $1.8 trillion, with about 30% of the offering reserved for individual investors. The stock climbed sharply on its debut, then gave back much of that gain over the following weeks as a large bond sale and AI-valuation nerves set in. It ended June above its IPO price but well off its highs.
The other big shift came from the Middle East. After roughly four months of conflict, the U.S. and Iran signed a preliminary agreement to end the war and reopen the Strait of Hormuz, the channel that carries a large share of the world's oil. Crude prices tumbled back toward pre-war levels, and the war premium that had lifted energy shares all spring came out just as fast. Energy was the second-worst sector, down 5.0%. Gold fell harder still. As geopolitical risk faded and interest-rate expectations firmed, gold dropped 11.7%, its safe-haven premium from the conflict largely erased. Overseas, developed markets were roughly flat, and emerging markets eased about 1.4% after a strong start to the year.
June Return Summary (by GICS Sector)
Bond Market
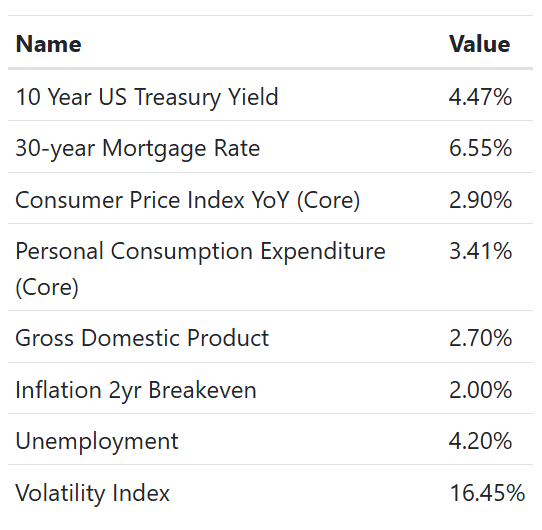
At his first meeting as Fed Chair, on June 16–17, Kevin Warsh kept the benchmark rate unchanged at 3.50%–3.75%, as per market expectations. The surprise was in the projections. In March, the median policymaker still expected a rate cut by year-end. The median now points to rates holding steady or moving higher, and nine of eighteen officials expect a hike for 2026. Warsh also dropped much of the forward guidance markets had grown used to. Investors read the shift as hawkish, and the 10-year Treasury yield drifted up to about 4.47%, near the top of its recent range.
Bond returns were mostly muted. The U.S. Aggregate Bond Index returned 0.2%, essentially flat. Global bonds lagged, down 0.7%, held back in part by a firmer dollar. The message in the numbers was simple: yields look likely to stay higher for longer than investors had hoped a few months ago.
Credit markets stayed calm through it all. High-yield bonds were flat on the month (+0.1%), and spreads showed none of the stress that tends to appear when investors turn defensive. For all the churn in stocks, the bond market's read on corporate health held steady.
Economic Dashboard
Economics
The economy itself held up well. GDP grew 2.7% from a year earlier, a steady pace that points to continued expansion rather than a boom or a stall. The labor market stayed firm, with unemployment near 4.2% and hiring still positive, but cooler than a year ago.
Inflation is where the picture got interesting. Headline consumer prices jumped to a 4.2% annual rate in May, the highest since 2023, almost entirely because the Iran conflict had pushed energy costs sharply higher. Strip out food and energy, though, and core inflation was far tamer at 2.9%. That gap matters. With the war winding down and oil falling, the energy spike behind the headline number should begin to reverse, and the bond market seems to agree, as the two-year breakeven rate of TIPS (expected inflation) dropped back toward 2% by month-end. The Fed's concern is that the spike lingers long enough to seep into core prices, which is the caution behind its hawkish tone.
Housing saw a touch of relief as the average 30-year mortgage rate eased to 6.55%, though affordability is still tight. Consumer spending has held up, and with markets calm (the VIX ended the month at a moderate 16.5), there was little sign of the anxiety a 4%-plus inflation headline might normally stir.
Portfolio Changes
in our Global Tactical ETF Portfolio, we swapped our diversified commodities & oil exposure in favor of Global airlines & lithium/battery tech, as the pressure on oil starts to come down.
In our Low Vol Tactical portfolio, we increased credit exposure, while reducing foreign bonds exposure.
For families with young children, a notable planning item went live on May 28: the Treasury Department launched its "Trump Accounts" app, the main interface for the new tax-deferred savings accounts for children. Children born between January 1, 2025 and December 31, 2028 are eligible for a one-time $1,000 federal contribution, and parents, along with employers, relatives, and others, can add up to $5,000 per year until the child turns 18, with the funds invested for long-term, tax-deferred growth. Account funding and the federal seed deposits begin July 4.
Thanks,
The Friedenthal Financial Team.